Introducing Root Cause Analysis and additional A.I. capabilities
Procore Analytics is designed to quickly turn project data into insight, and insight into action. The reports included in Procore Analytics not only help users manage and evaluate projects, but get to the heart of project risk by identifying factors that contribute to keeping projects on track and workers safe.
With the latest updates to Procore Analytics we’ve improved the user experience, enabled access to new datasets, and added new artificial intelligence powered visuals that give clear insight into what’s impacting your project metrics.
Introducing Root Cause Analysis
Understanding the data behind important metrics and finding the cause of a problem – like a spike in incidents or injuries – is vital to mitigating risk and promoting safety, which is why the ability to perform root cause analysis and exploration of quality and safety metrics is now included in the Quality and Safety report.
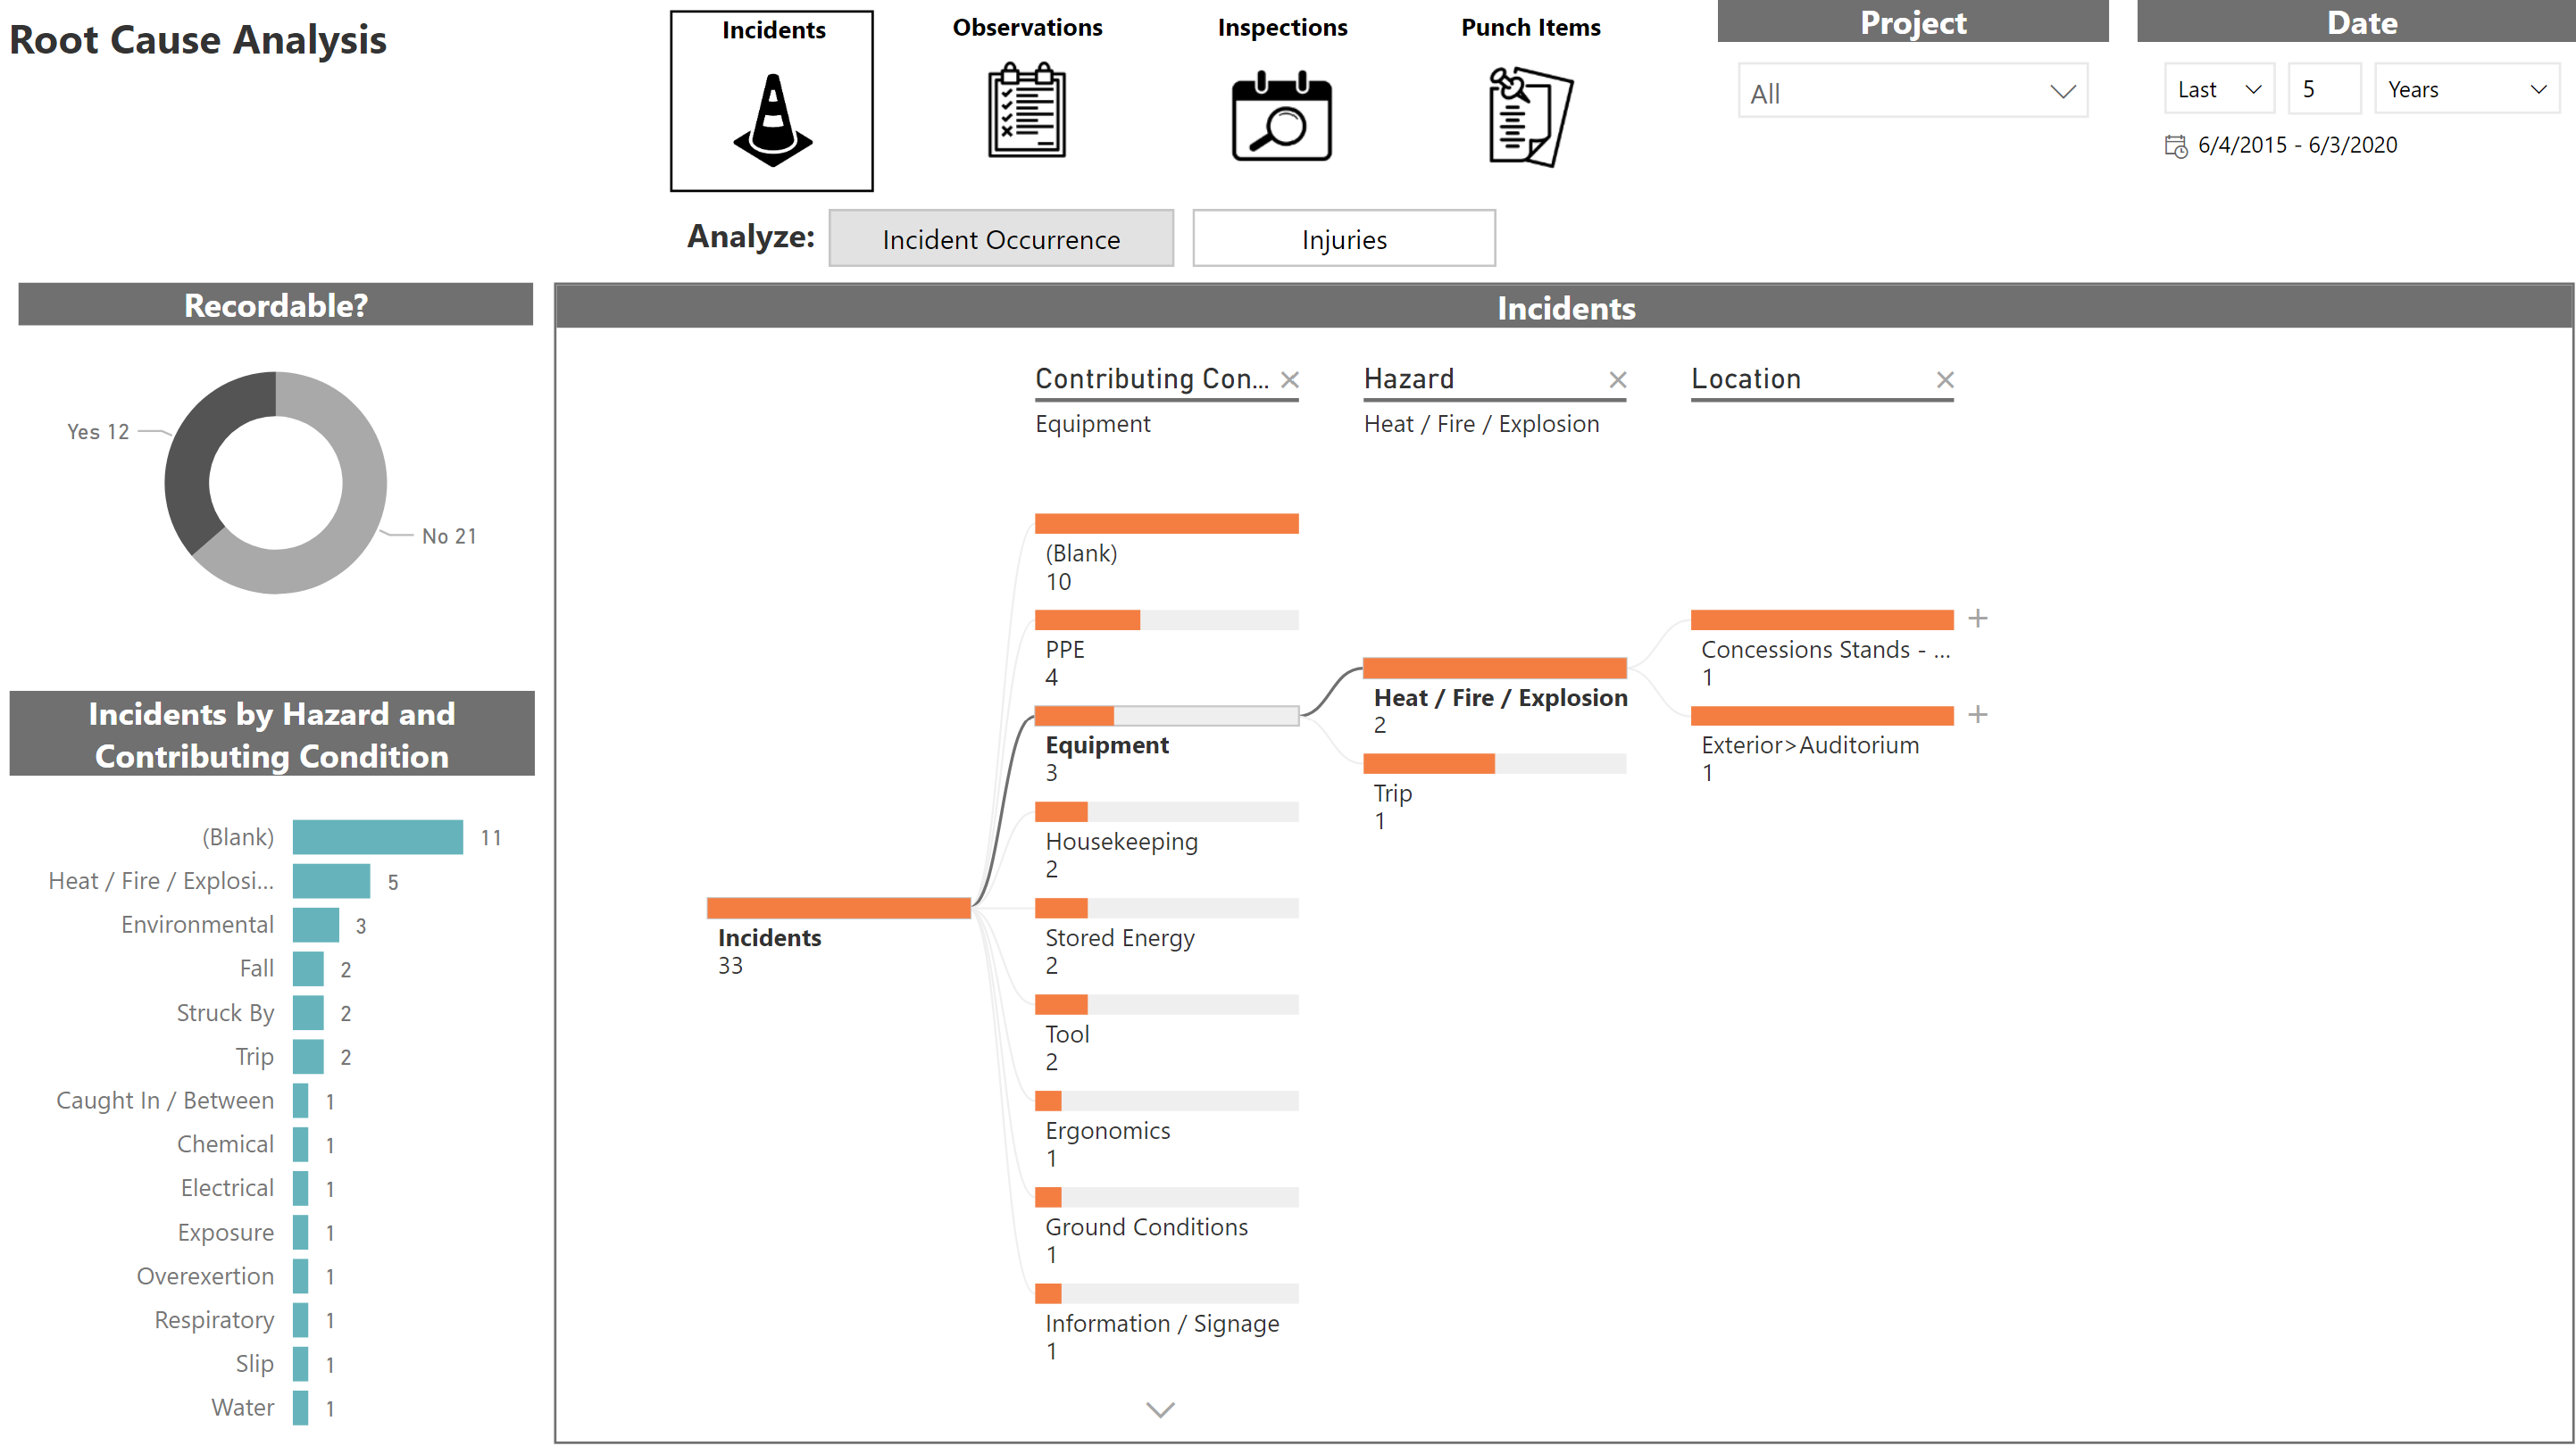
Buttons along the top allow users to view data for Incidents, Observations, Inspections, or Punch Items. The Incidents view has additional selections for analysis, letting users analyze either incident occurrences or injuries. Each view contains a dynamic visual, which enables artificial intelligence-driven root cause analysis and user-driven exploration. There are also filtering options in the upper right and quick reference charts along the left that call out important data and allow for easy cross filtering.
With root cause analysis, users can click to break down a metric by a specific field and its values, or they can have artificial intelligence identify and display which field impacts a metric the most.
To highlight these capabilities further, let’s use the visual in a real scenario to answer a specific question: What’s the root cause of injuries where “Equipment” is identified as the harm source? The injury count metric is broken down in the below animation to answer this question.
Harm Source is selected first then artificial intelligence is used to identify where injury count is highest in the rest of the data. Fields identified using artificial intelligence appear with a lightbulb next to them.
The entire visual is interactive even when expanded, so users can click different values to highlight different paths or click the visuals to the left to crossfilter what’s displayed. Clicking different values changes the data breakdown and clicking “yes” in the Recordable donut chart filters the entire page to display data from recordable incidents only.
Empowered with this information users can investigate further or take action to reduce risk of injury based on the root causes found.
Additional Insight with Key Influencers
Key Influencers is another artificial intelligence powered visual that identifies and displays which factors in your data most influence a project metric to fall into a certain classification, like “late,” “high,” or “overbudget.” In this release, Key Influencers has been added to both the Budget and Quality and Safety reports to give users a more complete picture of what influences those metrics. For example, in the Budget report, users can explore which factors contribute to project budgets being “overbudget.”
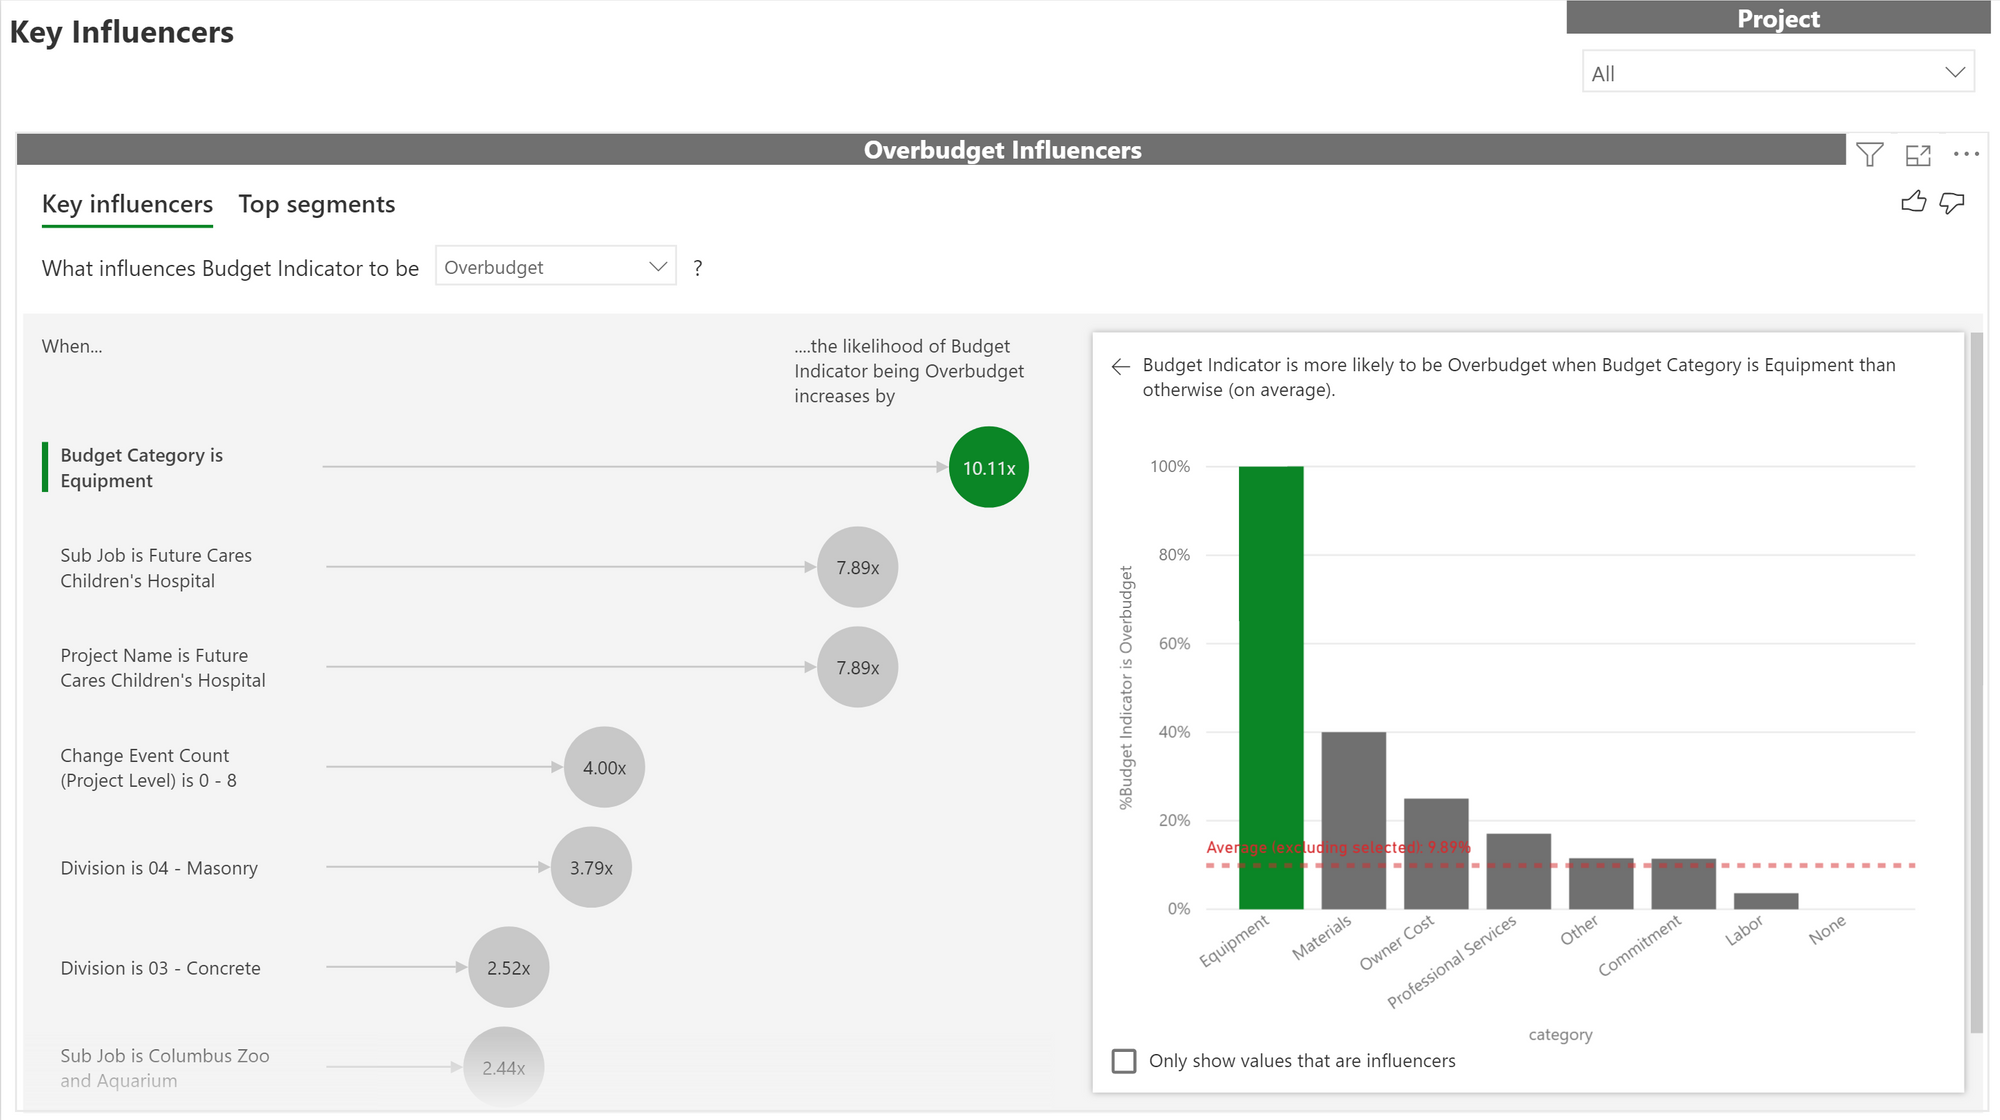
Users can click between tabbed views and select bubbles to explore all the factors that contribute to the state of budgets. The first tab, Key Influencers, shows which individual factors have the most influence. Each bubble can be selected to display detailed, graphical information about it. The second tab, Top Segments, displays which factors together have the biggest impact. These bubbles can also be clicked to get a detailed breakdown of the segment. Check out the animation to see it in action.
All of these pieces work together to surface potential areas for improvement and to give a complete picture of what affects project budgets most.
The artificial intelligence features included in this release update of Procore Analytics were designed to foster a deep understanding of project data and the factors impacting vital metrics. Additional artificial intelligence features like these will be coming to future releases, empowering Procore Analytics users to run successful, streamlined projects.
Please reach out to request a demo of Procore Analytics to see how you and your business can go from insight to action. For a complete list of the additions and updates in this latest release, please check out our release notes.