Procore Construction Benchmarks: Setting a new bar for project performance
Benchmarks can be a guiding light for construction firms trying to replicate project successes, mitigate projects risks, and avoid project failures. Benchmarks are goal posts designed to help users determine if the proverbial “ball” is going through the uprights.
The last major publication of construction industry benchmarks was done by the Navigant Construction Forum back in 2013. The study examined 1,362 projects to determine the impact of RFIs. Construction projects face some very different challenges today, and having up to date benchmarks is essential if they’re going to be of any use to today’s construction professional.
Procore is establishing the next generation of industry benchmarks for construction. For this analysis, Procore started with two of the most fundamental processes in construction, RFIs and submittals. The data presented below represents benchmarks across the industry.
"I believe the digitization of the construction industry will enable predictive analytics to be the most transformational change we have ever experienced. Organizations without strong cultures to embrace it will cease to exist." - Carl McFarland, Kitchell
Thanks to knowledge built over nearly 20 years of serving construction and our recent investments in machine learning, we’re also able to build benchmarks specific to a project. These will allow you to compare your project only to ones of similar budget, type, and size. Benchmarks are a stepping stone towards predictive analytics that will enable customers to know both where they stand and how they can take specific actions to reach their desired project outcomes.
“Getting actionable outcomes from analyzing our data is the most important thing that we look to do in our analytics endeavors. You can verbally inform a group that performance is missing the mark ten times with no outcome, but when factual evidence backed by data is presented, there is almost always an immediate response. Using benchmarks moves this needle because when insights are compared to industry and organizational standards, there is a definitive response to improve to meet and exceed the benchmarked goals.” - Patrick Hennessy, Harkins
Industry-wide RFI benchmarks: Key findings
Project timelines
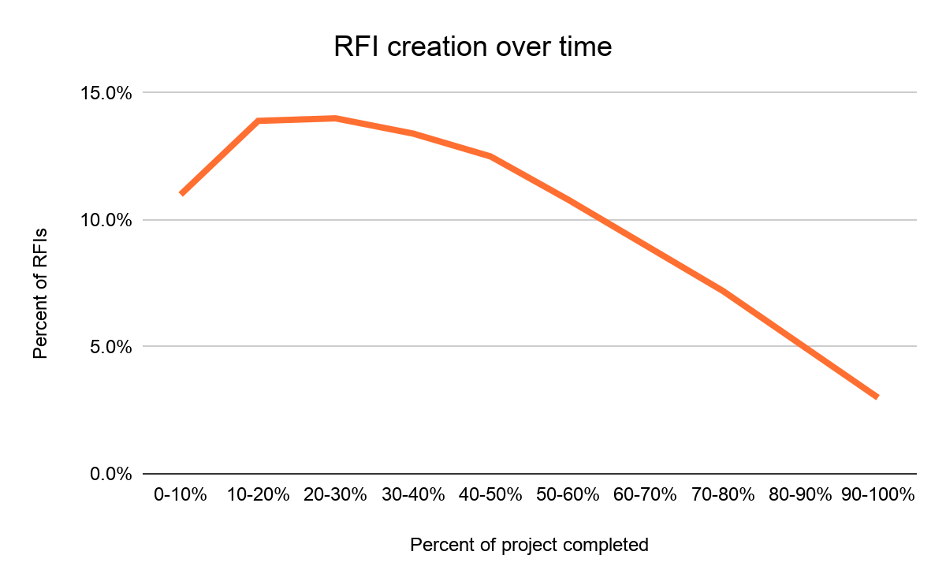
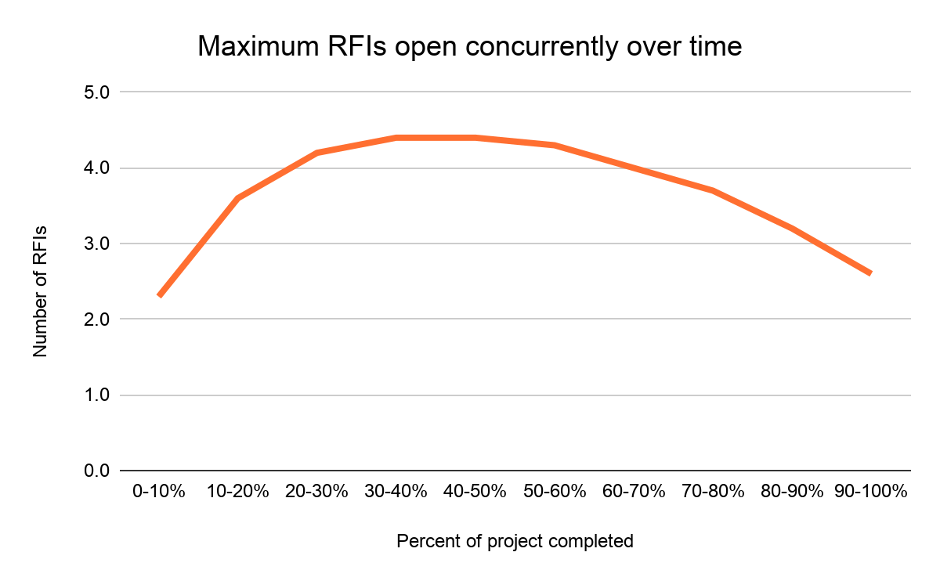
RFI creation peaks between 10-30% of a project’s timeline, and drops off as a project nears completion. Projects have the most open RFIs between 30-50% of project completion, following the period of highest RFI creation. This held true no matter the project budget. Construction managers and design/engineering teams should expect higher construction administration needs during this point in a project - are you staffing your projects to accommodate this increased load?
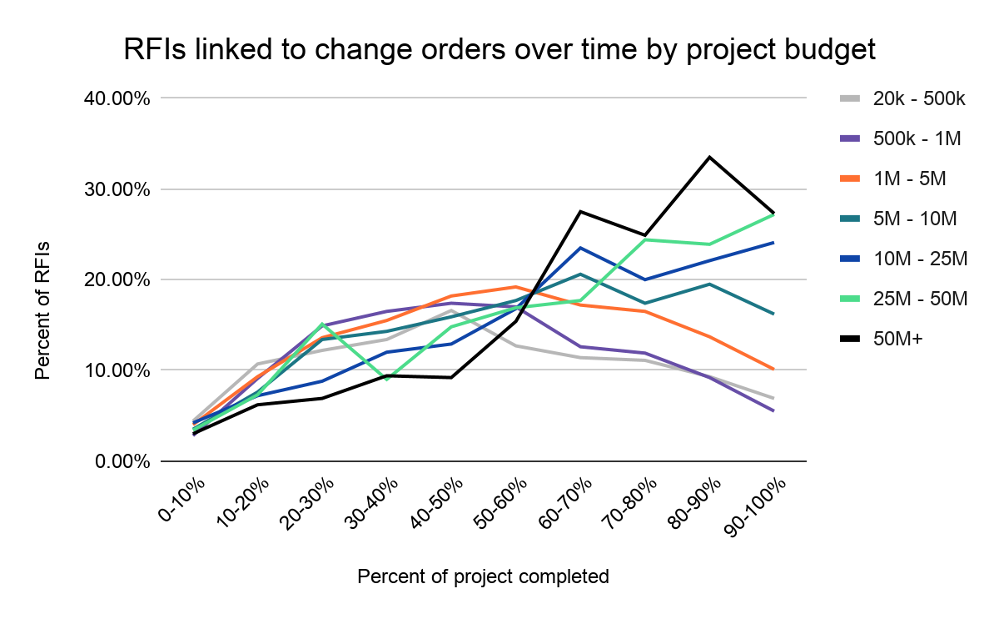
It is commonly said that the later an RFI occurs in a project, the more likely it is to have a cost or schedule impact. The chart below, with the percentage of RFIs linked to change orders, shows that that trend is largely true, particularly on larger projects. This highlights the need to get as many design and scope related RFIs resolved as early as possible.
Ask yourself - when is your team asking questions? When are RFIs being created? Using Procore’s reporting capabilities you can look at what point in a project RFIs are being created and see if your RFI creation peaks earlier or later than the average.
RFI turn around time
The average time from when an RFI is opened to first response is 7.3 calendar days. Benchmarking will be able to show you if you’re receiving RFI responses more quickly or slowly than this average across all your projects and responsible parties.
RFI creation by budget
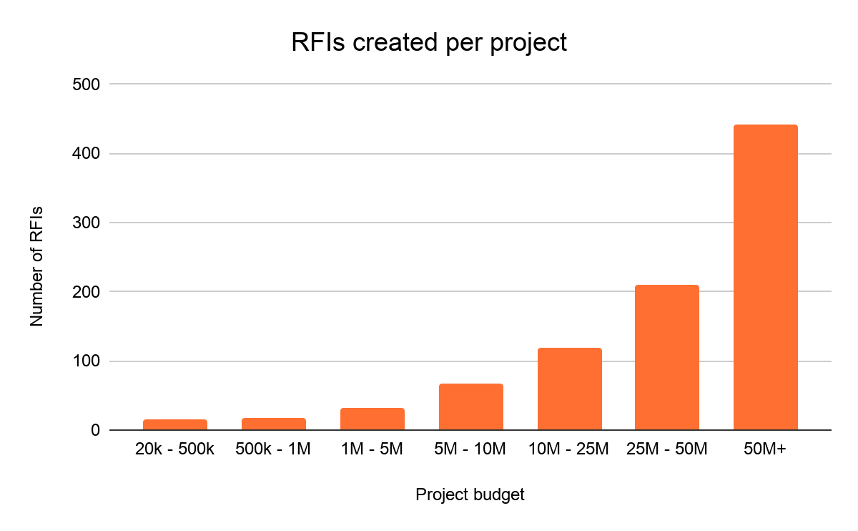
Project budget is directly related to the number of RFIs on a project. When comparing your projects to our benchmarks, we’ll only show you projects that are similar, ensuring that you can see how RFI creation compares only to relevant other projects.
While these numbers may seem small or large to you, there are many approaches to how teams write RFIs - combining multiple questions into a single RFI for example - that may impact the total number on a given project. Benchmarks allow you to ask questions about why you may be below or above an average - is it because of your processes? Or is your project at risk?
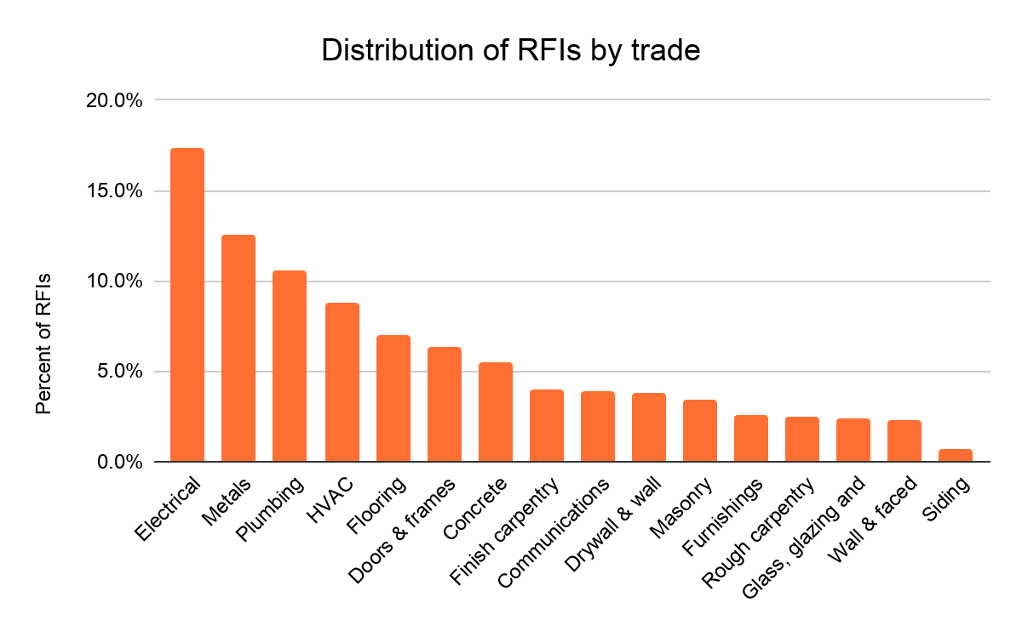
RFI creation by trade
One of the benefits of using machine learning to design these benchmarks is that we can achieve high levels of accuracy and specificity. Procore built a machine learning model that can tag an RFI with the primary trade affected by it. With this information, you will be able to understand how each trade on a project should be performing, relative to each other, in terms of RFI creation. When combined with the ability to compare your project to similar projects, you’ll be able to quickly identify what the outliers are that you should be paying attention to.
You’ll also be able to understand which trades typically have the highest number of RFIs and thus know to prioritize identifying potential questions from those trades early on to de-risk your project. The chart below shows a selection of common trades that we analyzed.
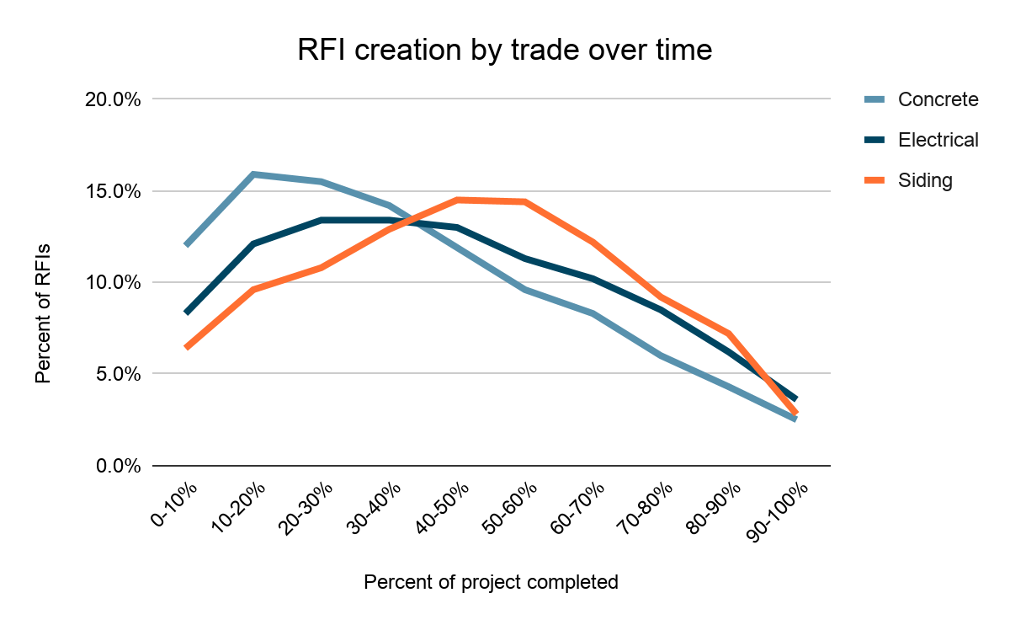
The rate of creation of RFIs over time differs by trade. Trades that are typically on site earlier, like concrete, generate RFIs earlier compared to trades that are on site later, like siding. By breaking RFI creation down by trade in this way, we can alert project teams if their project is deviating from trade norms.
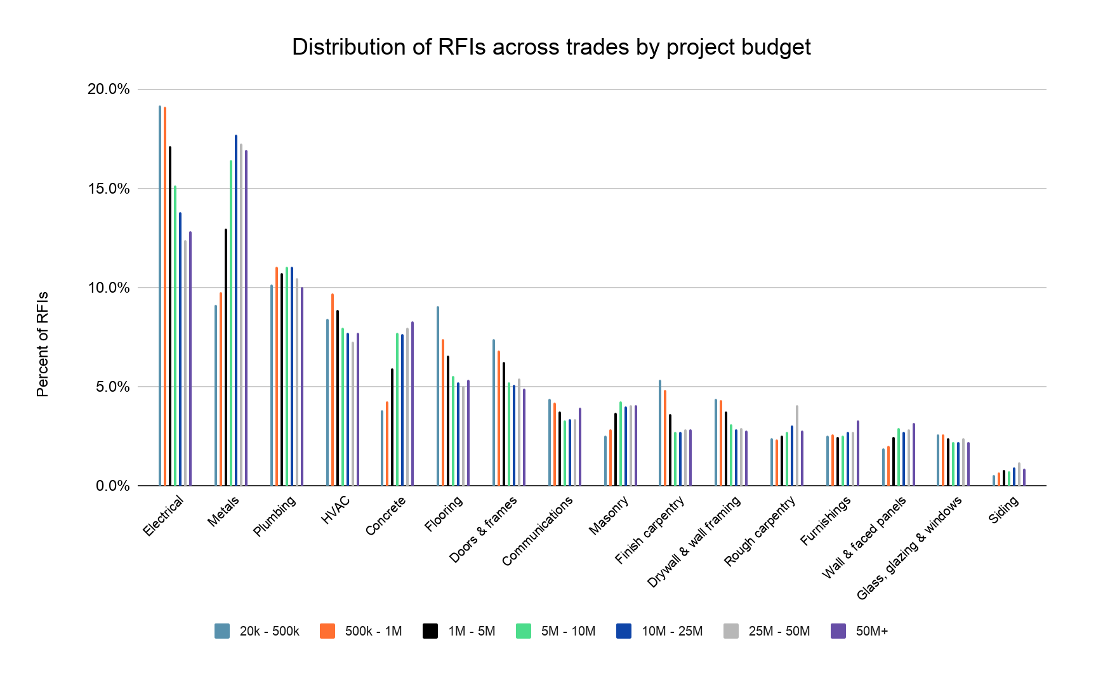
The distribution of RFIs by trade is similar across project budgets for some trades, like plumbing, and different for others. Smaller projects have a relatively smaller percentage of RFIs from concrete and metals, likely due to having fewer structural elements. Breaking down this information by budget allows you to ask how your projects compare to those that are the most similar.
Industry-wide submittal benchmarks: Key findings
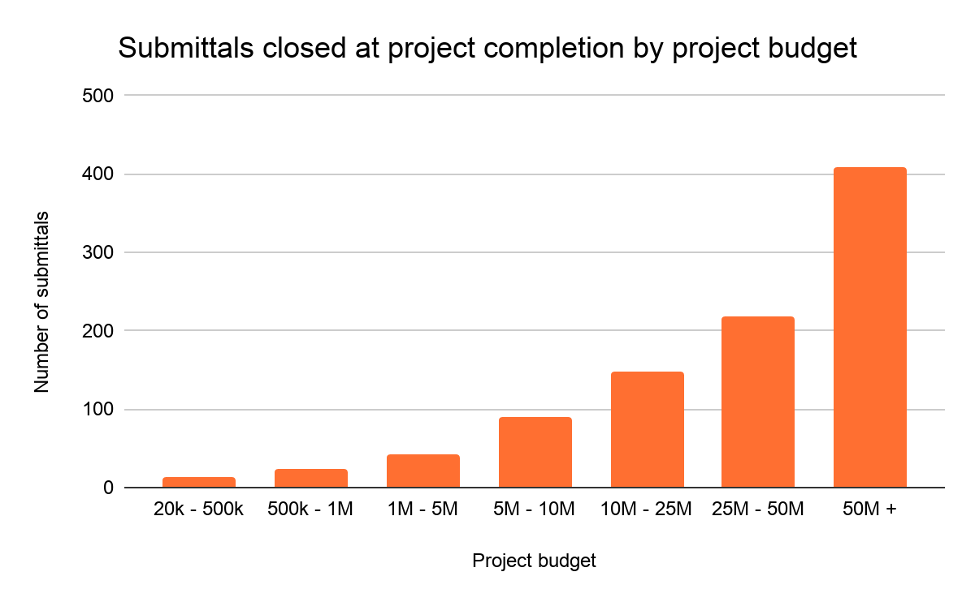
Submittals by budget
Similar to RFIs, the number of submittals closed on a project at project completion is directly related to the project’s budget.
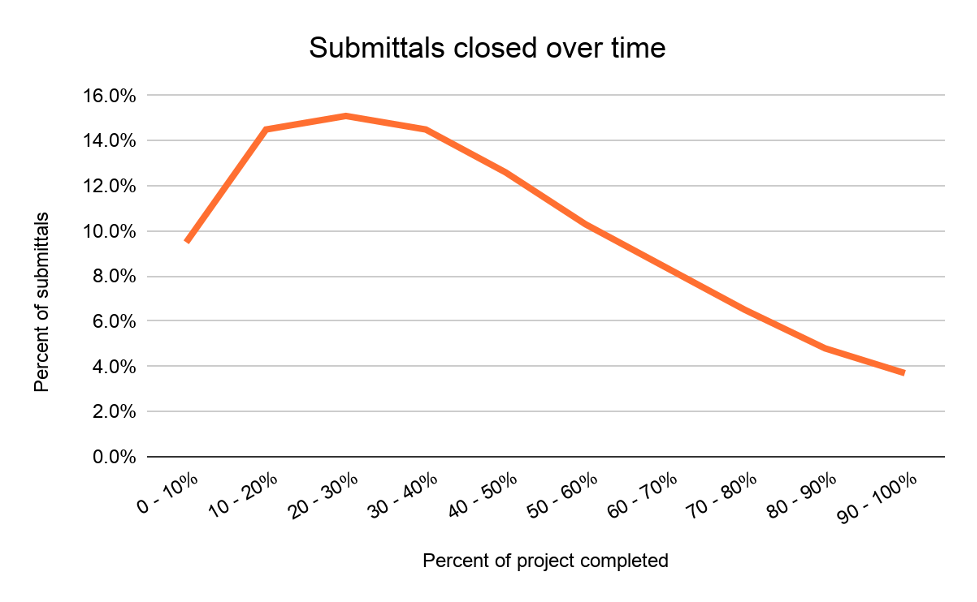
Percent closed over time
Submittal close rate is highest in the 10-40% period of the project timeline and tails off as the project progresses. This information can help you understand if your submittal close rate on a project is proceeding at a similar pace, or if it is falling behind, potentially indicating a delay.
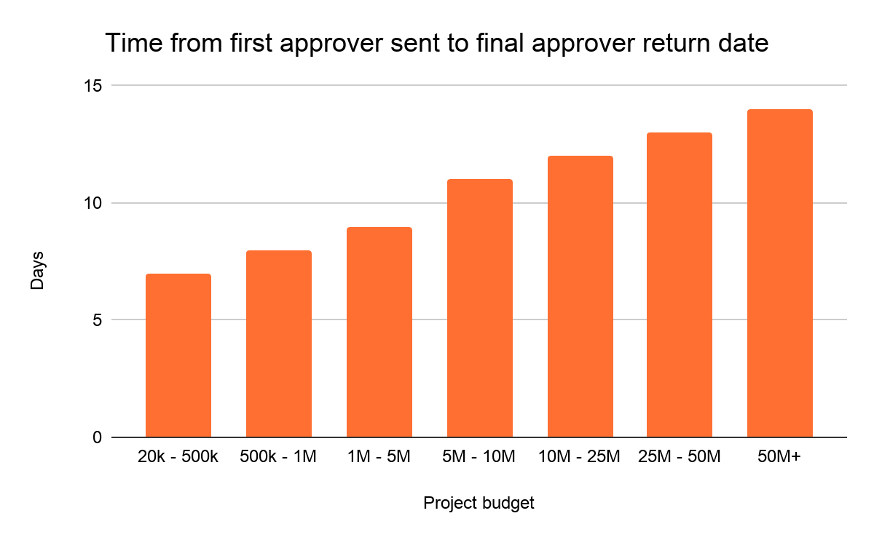
Submittal turn around time
Across all projects, the average time between first sent date to final return date is 10 calendar days. Broken down by budget, the duration from first approver sent to final approver return date grows as project size increases.
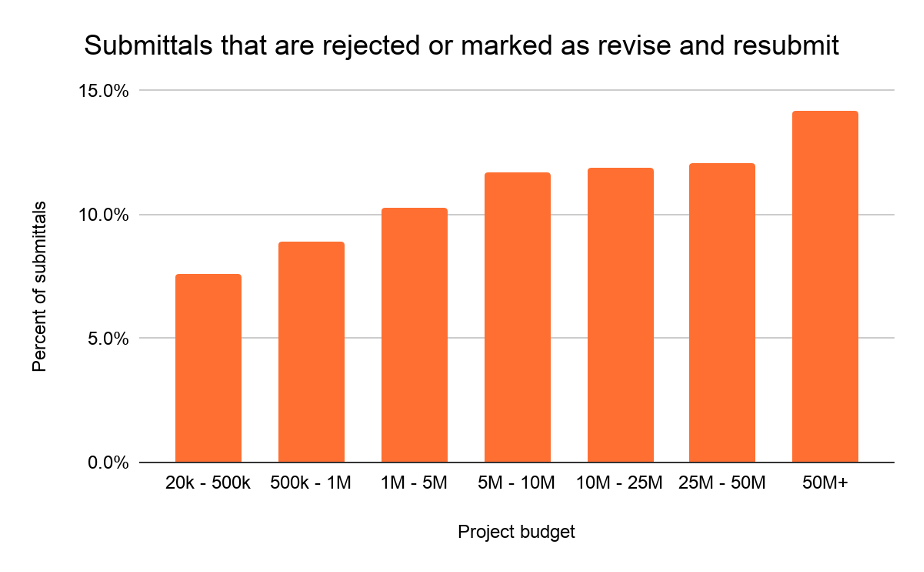
Percent being rejected or marked as revise and resubmit
Overall, 9.2% of submittals are rejected or marked as revise and resubmit. When broken down by budget, we can see that larger projects tend to have a higher percentage of submittals that fall into this category. How do your projects compare?
What's next
Submittals and RFI benchmarks are only the beginning of what Procore plans to do. Procore is continuing to invest in its data and machine learning capabilities, delivering advanced functionality that enables construction companies to achieve better outcomes by leveraging data.
To find out more about Procore’s investments in analytics and machine learning visit Procore.com/analytics or contact a representative to request a demo.